TestPro_1
usability evaluation
1. Learnability
Beginners are not familiar with the product, that is, the user’s learning process, the difficulty of the process, the speed is learning; poor learning for the user who just used the product, may be abandoned due to this obstacle.
1.1 Coaching Method
1.1.1 Overview
This technique can be used for usability test, where the participants are allowed to ask any system-related questions of an expert coach who will answer to the best of his or her ability. Usually the tester serves as the coach. One variant of the method involves a separate expert user serving as the coach, while the tester observes both the interaction between the participant and the computer, and the interaction between the participant and the coach.
The purpose of this technique is to discover the information needs of users in order to provide better training and documentation, as well as possibly redesign the interface to avoid the need for the questions. When an expert user is used as the coach, the expert user’s mental model of the system can also be analyzed by the tester.
The tester can also control the answers to certain predetermined information.
1.1.2 data needed
The answer and the degree how it help user to achieve the task.
1.1.3 report
In an extensive series of experiments, one could vary the coach’s answers in order to learn what types of answers helped users the most. But this requires skilled and careful coaches since they need to compose answers on the fly to unpredictable user questions.
1.2 Question-asking Protocol
1.2.1 Overview
During a usability test, besides letting the test users to verbalize their thoughts as in the thinking aloud protocol, the testers prompt them by asking direct questions about the product, in order to understand their mental model of the system and the tasks, and where they have trouble in understanding and using the system. This is a more natural way than the thinking-aloud method in letting the test user to verbalize their thoughts.
Providing the test users with the product to be tested (or a prototype of its interface) and a set of tasks to perform. Ask the participants to perform the tasks using the product, and explain what they’re thinking about while working with the product’s interface. Also ask them pointed, direct questions about the product; for example, “How would you send the booking order?” Their response, either in terms of the product being tested or in other products from their past experience, will provide insights into their mental model of the product.
1.2.2 data needed
Collecting users’ response.
1.2.3 report
Analysis the response of users, extract key points and think about the shortcut of our product.
1.3 Task-Driven Method
1.3.1 Overview
Providing the test users with the product to be tested (or a prototype of its interface) and a set of tasks to perform. It should be divided into several stages and each stage has a time interval.
For example, in the case of task time, the same subject performs the same task. The first test completion time is 50 seconds, the next test is 40 seconds, and the other month is 35; the test subject’s performance time tends to be stable. That is the maximum degree of performance of the task. By improving the product and then detecting changes in the indicator, wer may see if there is improvement in learning.
1.3.2 data needed
- The stage and time users take to complete a specific task.
- The stage and number of task of various kinds that can be completed within a give time limit.
1.3.3 report
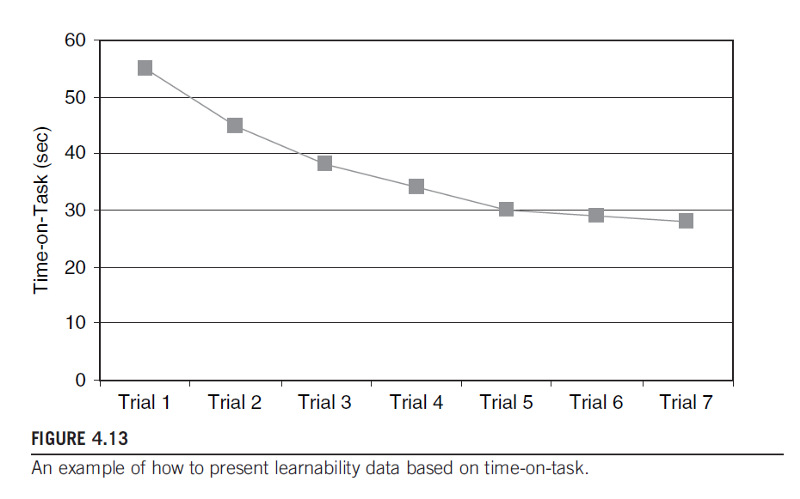
Finally we should get a stable data, we could use mean or median to show the learnability of our product.
1.4 Performance Measurement
1.4.1 Overview
This technique is to used to obtain quantitative data about test participants’ performance when they perform the tasks during usability test. This will generally prohibit an interaction between the participant and the tester during the test that will affect the quantitative performance data. It should be conducted in a formal usability laboratory so that the data can be collected accurately and possible unexpected interference is minimized. Quantitative data is most useful in doing comparative testing, or testing against predefined benmarks. To obtain dependable results, at least 5 user participants are needed, while 8 or more participants would be more desirable. The technique can be used in combination with retrospective testing, post-test interview or questionnaires so that both quantitative and qualitative data are obtained.It can be also used in combination with task-driven method so that we get concrete tasks. The technique can be used in the following development stages: code, test, and deployment.
1.4.2 Procedure
Define the Goals
Define the goals for the usability testing in terms of usability attribute (e.g. easy to learn, efficietn to use, easy to remember, few errors, subjectively pleasing).
Balance the various components of the goals and decide on their relative importance.
Quantify these usability issues by measurements such as those given below:
- The time users take to complete a specific task.
- The number of task of various kinds that can be completed within a give time limit.
- The Ratio between successful interactions and errors.
- The time spent recovering from errors.
- The number of user errors.
- The number of commands or other features that were never used by the user.
- The number of syste features the user can remember during a debriefing after the test.
- The frequency of use of the manuals and/or the help system, and the time spent using them.
- The proportion of users who say that they would prefer using the system over some specified competitor.
- The proportion of users using efficient efficient working strategies in case there are multiple ways of performing the tasks.
Conduct the Test
Even though this technique is aimed to collect quantitative data, it should be noticed
that it’s very important to collect qualitative data to uncover the user’s mental process and other information behind the quantitative data and take them into account while drawing the conclusions.
1.4.3 data needed
- The time users take to complete a specific task.
- The number of task of various kinds that can be completed within a give time limit.
- The Ratio between successful interactions and errors.
- The time spent recovering from errors.
- The number of user errors.
- The number of commands or other features that were never used by the user.
- The number of syste features the user can remember during a debriefing after the test.
- The frequency of use of the manuals and/or the help system, and the time spent using them.
- The proportion of users who say that they would prefer using the system over some specified competitor.
- The proportion of users using efficient efficient working strategies in case there are multiple ways of performing the tasks.
1.4.4 Analyze the Data to Draw the Conclusions
To compare with a benchmark value (for ordinal, interval, or ratio data), mean or median can be calculated, together with standard deviation, standard error of the mean, and the confidence intervals.
To compare the data from different user interfaces, some kind of inferential statistics test can be performed.
###